Quick Answer
To find stocks holding key support in a weak market, screen for names pulling back to a moving average while their longer trend is still rising. In TradeVision AI Labs, the prompt "find stocks pulling back to their 20 day moving average while above a rising 50 day moving average" does this in one step.
Run these prompts yourself in AI Labs
What "holding support" means, and why the wording of a prompt matters
Support is a price area where buyers have tended to step in. Many traders use moving averages as a simple stand-in for it. A moving average is the average closing price over a set number of days, drawn as a line on the chart. When a stock in an uptrend dips back to that line and stays above it, traders say it is holding support.
On a day when most of the market is falling, a loose prompt gives a messy list. In our 5 November 2026 livestream, Brett put it this way: the prompt has to separate a healthy pullback from a falling stock. Ask an AI screener only for stocks that have fallen and you get both kinds mixed together.
The fix is to add guard rails. Brett named three: a rising longer-term trend, relative strength, and support nearby.
How to screen for it, step by step
We ran three prompts in AI Labs 2.0, each for a different kind of pullback. All results are from 5 November 2026 and are shown to explain the method.
Step 1. Open an Auto widget in AI Labs
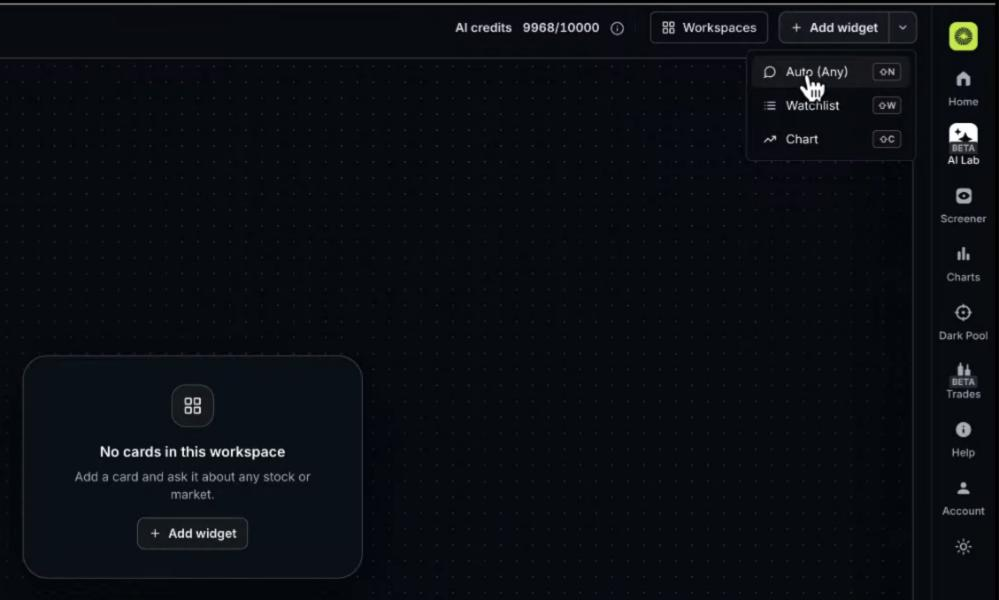
In TradeVision, open AI Labs, pick a workspace, click Add Widget and choose Auto. Type your prompt in plain English and send it.
Step 2. Prompt for a shallow pullback inside an uptrend
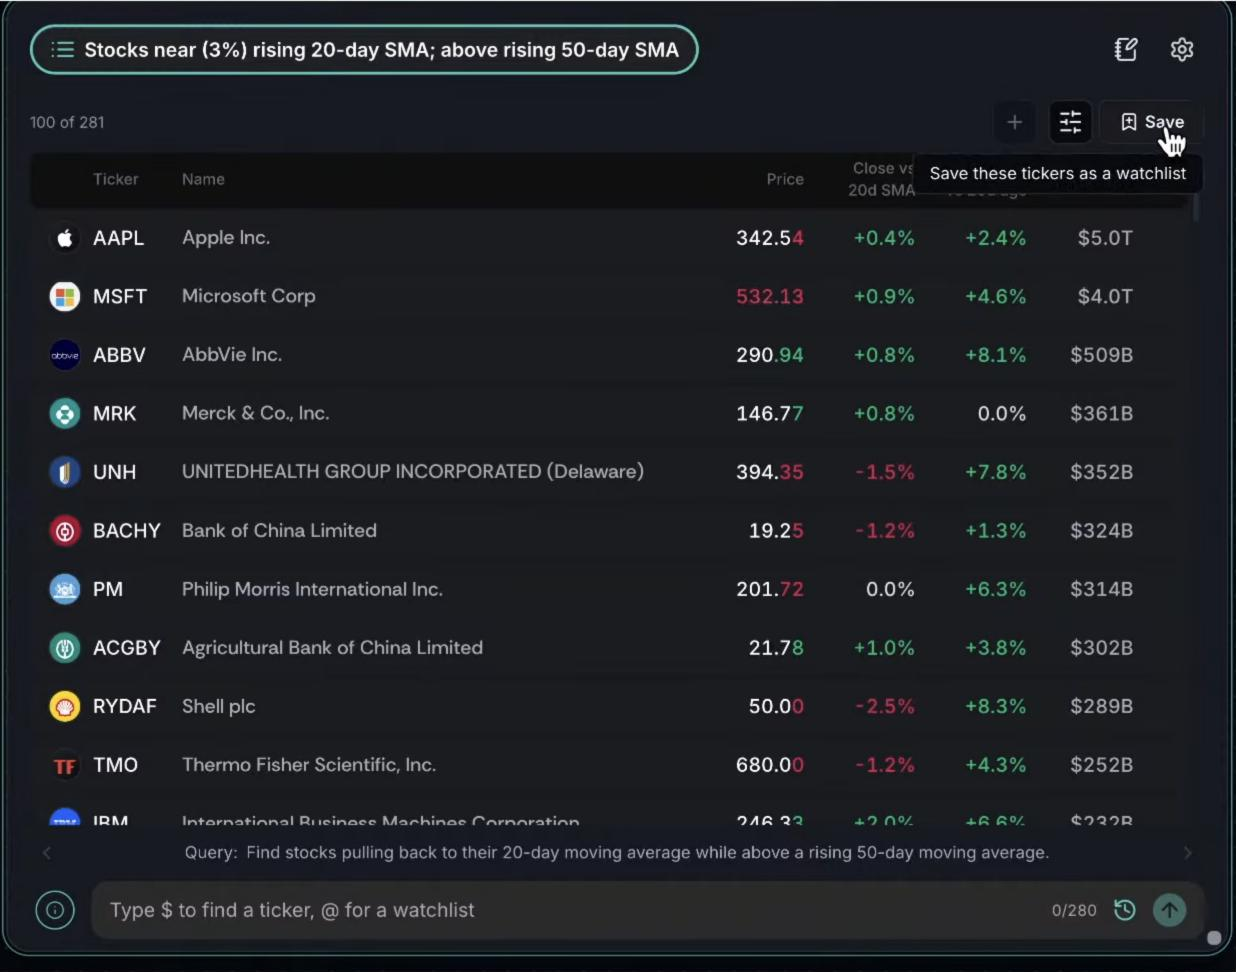
Find stocks pulling back to their 20 day moving average while above a rising 50 day moving average
The prompt names a specific place to pull back to (the 20-day average) and a trend condition (a 50-day average that is still rising). AI Labs returned 281 stocks and showed the first 100, sorted by market value.
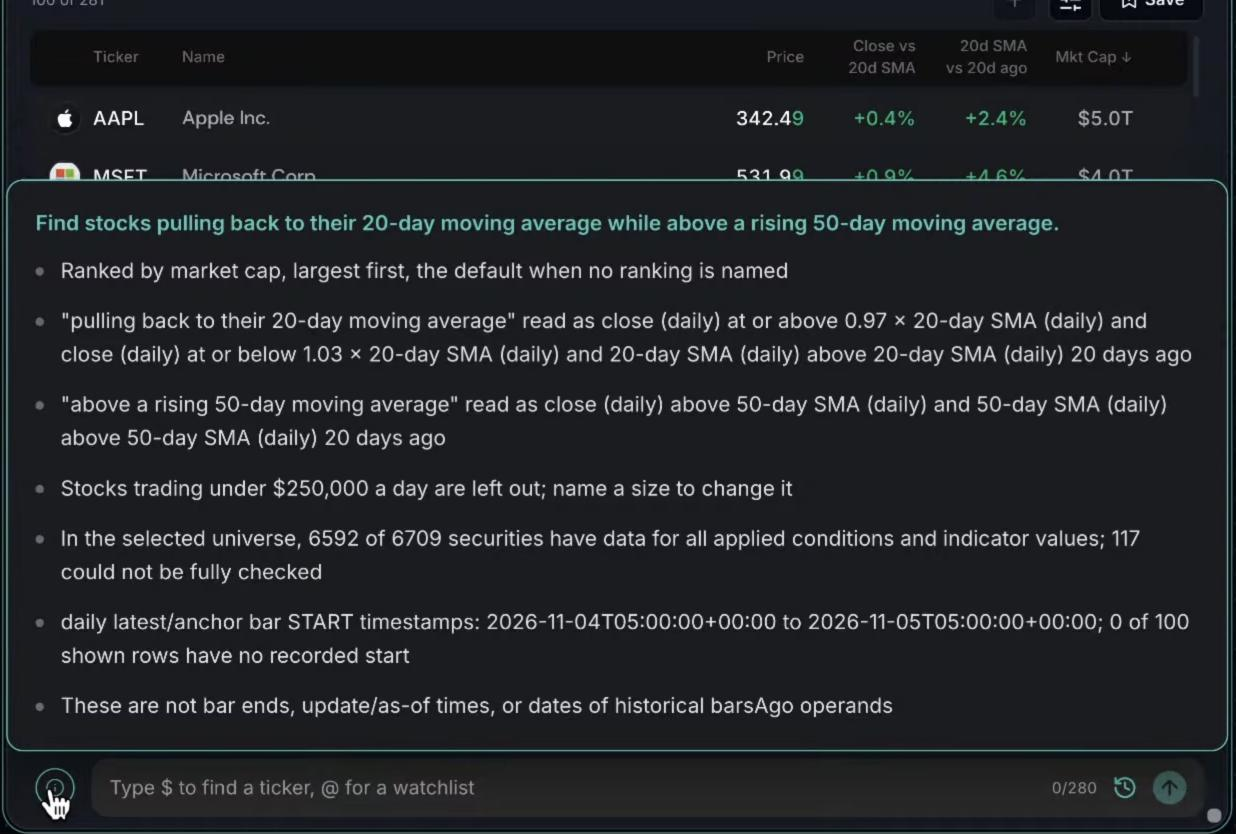
Before trusting any list, hover over the eye icon at the bottom of the widget. It shows exactly what the AI searched for, which is not always what you meant. Here it read "pulling back to" as a close within 3% of the 20-day average, and it left out stocks trading under $250,000 a day.
Step 3. Check the first few results on a chart
Click the three dots next to a result and choose Go to chart. Add the 20-day and 50-day simple moving averages (SMA) from the Indicators menu, then ask one question: does this chart match what I asked for?
We opened the first three results, which that day were Apple, Microsoft and AbbVie. In each case the price had dipped to the 20-day line and the 50-day line below it was still sloping up. The prompt had done what we asked.
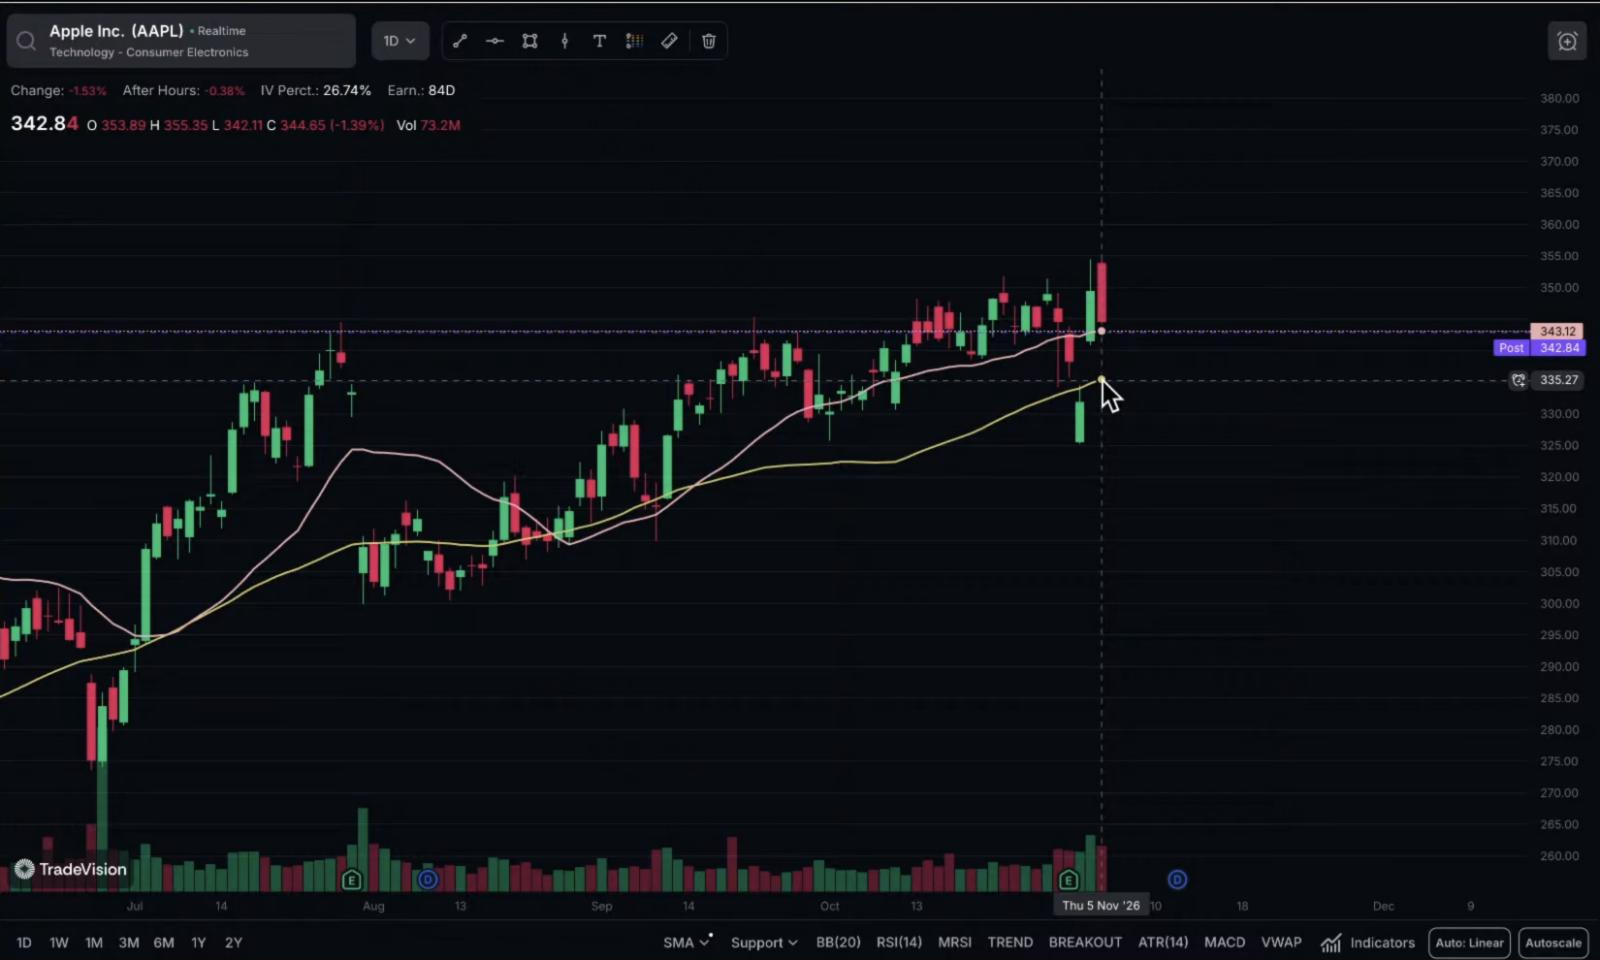
Matching the prompt is all that check tells you. As Brett said on the stream, a stock sitting on its 20-day average can still turn lower the next day.
See it on a live chart. Copy the prompt above into AI Labs and check the results yourself. Try TradeVision free for 7 days
Step 4. Save the list and sort it in the Screener
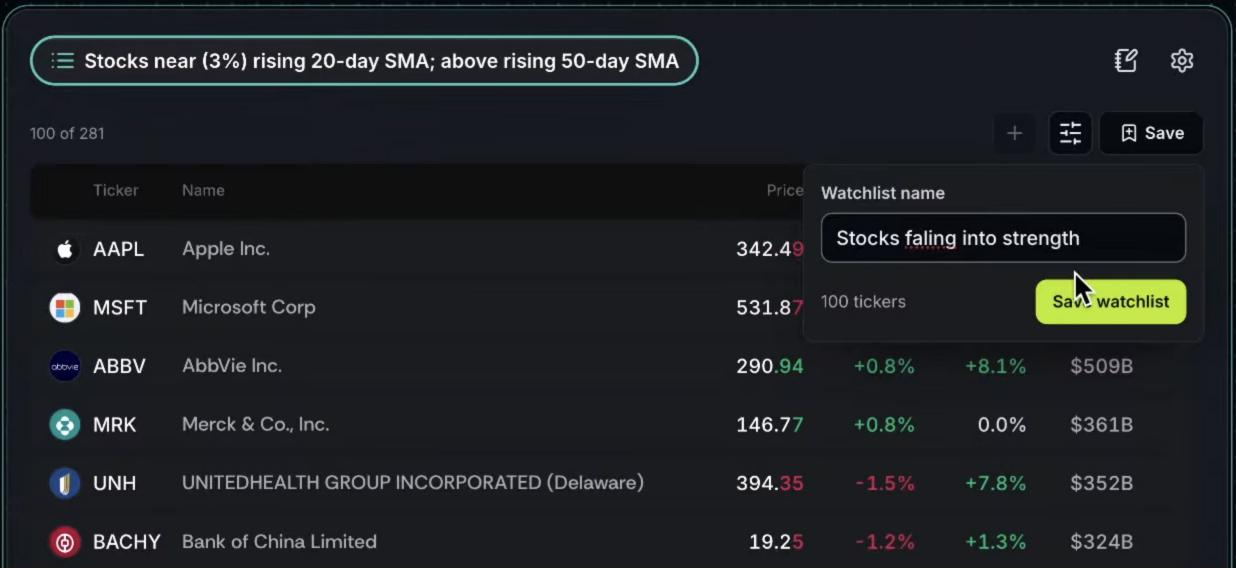
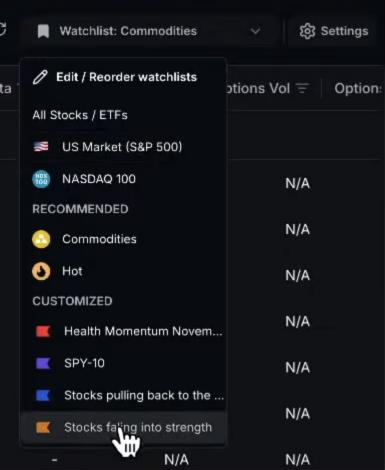
Click Save these tickers as a watchlist at the top of the widget, then open the Screener and pick that watchlist in the top right corner. You can now sort the same stocks by the day's change, next earnings date, options implied volatility and more.
Step 5. Prompt for deeper pullbacks, with a valuation filter
A viewer asked how to find bigger dips. The second prompt looks for stocks that have fallen hard but still earn money:
Find stocks with a 14 day RSI below 30 and a positive PE ratio below their industry average
RSI, the relative strength index, is a 0 to 100 gauge of recent buying and selling pressure. Below 30 is commonly called oversold, meaning the stock has been sold heavily in a short time. The P/E ratio is the share price divided by a year of earnings per share.
AI Labs found 131 stocks and noted that it couldn't check 37 more because data was missing. The first two charts we opened had RSI readings of about 27 and 26, and both were in steep declines with no sign of a turn.

This list needs the most care. Oversold describes what happened, not what happens next, and a low P/E can mean the price already reflects a business problem.
Step 6. Prompt for an early recovery above the long-term trend
The third prompt adds a confirmation step:
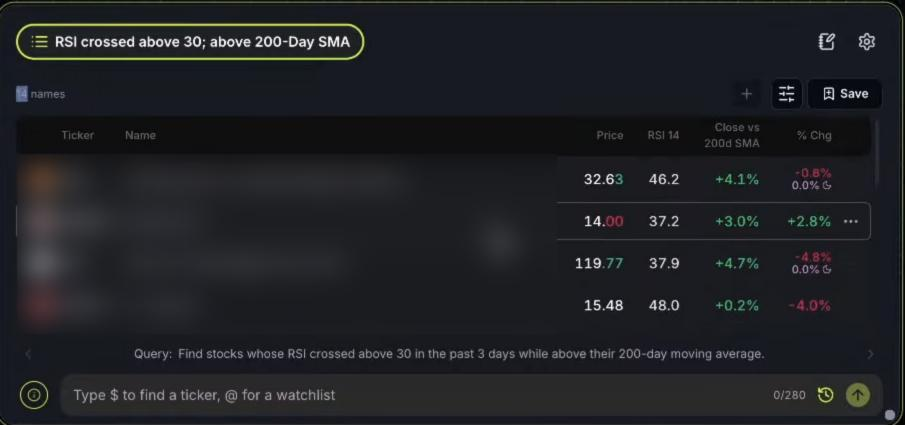
Find stocks whose RSI crossed above 30 in the past three days while above their 200-day moving average
The idea is to find stocks that were oversold, have started to recover, and never lost their long-term trend line. It returned only 14 names.
This is the prompt that only partly worked. We saved the 14 as a watchlist and opened every chart. Several fit well: RSI had dipped under 30 and climbed back, with price above the 200-day average. But at least three were still below their 200-day average, and about five still had an RSI under 30. The screen narrowed the field. It did not replace looking.
Step 7. Set an alert
Brett's suggestion was to keep alerts simple: a plain price alert a little above a level you care about, or an alert for price crossing above the 200-day SMA. TradeVision also has a relative volume alert, but a basic price alert is usually enough to prompt a second look.
Watch the session
What this screen can and cannot tell you
A screen like this is a starting point for your own research. Five things help you get more out of it:
- Support is a guide, not a floor. A moving average is an average of past prices, so treat it as a reference line that price can move through.
- Oversold describes what has happened. An RSI under 30 tells you selling has been heavy. It does not tell you when that ends.
- A low P/E is a question worth asking. It can mean a stock is inexpensive, or that earnings are expected to fall. The company's results will tell you which.
- Check the results against the chart. An AI screener interprets plain English, so some results will not fit. In our third prompt several did not meet both conditions, and the second prompt left out 37 stocks that lacked data.
- Rerun the screen. These lists came from one volatile day, and the same prompt will return different names tomorrow. Refreshing the widget keeps the list current.
This article is for education only and is not financial advice. TradeVision is a research tool and does not execute trades. Examples are from a livestream on 5 November 2026 and are shown to explain a method, not to suggest any investment. Always do your own research.
Related TradeVision tools and guides
- How to Verify Stock Screener Results: three quick checks for any list a screener gives you.
- AI Stock Screener: How to Prompt It for Breakouts: more prompts, including ones that failed.
- How to Be Ready Before a Stock Moves: planning levels and setting price alerts.
- Simple Moving Averages in Trading: how the lines used in this post are calculated.
- Tutorials: Moving Average, Relative Strength Index (RSI), Support and Resistance Levels.