
The plan is built while nothing is happening, so that when the move comes you are executing rather than deciding.
- Mark the price level that matters,
- Decide your entry and your stop loss before you commit,
- Work out your risk per share.
- Set a price alert slightly above your intended entry so the platform tells you when the stock approaches it.
Finding the Stock Is the Easy Part
Last week we used AI Labs to find stocks moving above resistance, running a simple query in the workspace and reviewing what came back. Four names made the shortlist and went onto a watchlist.
A week later, three were up and one had pulled back below where we found it. Which is roughly what you would expect, and it is not the interesting part.
The interesting part is what happens next. Finding a candidate is where most people stop. The traders who do well are the ones who decide, in advance and while nothing is happening, exactly what they will do if the stock reaches a particular price. That decision is much harder to make well in the moment.
Step 1: Mark the Level That Actually Matters
Once a stock breaks above resistance, that old resistance level often becomes support. The reason is straightforward: it was a price where sellers previously stepped in, so once it is cleared, buyers tend to defend it.
That gives you a reference point rather than a guess. Instead of watching a chart and wondering whether now is a good entry, you have a level and a plan attached to it.
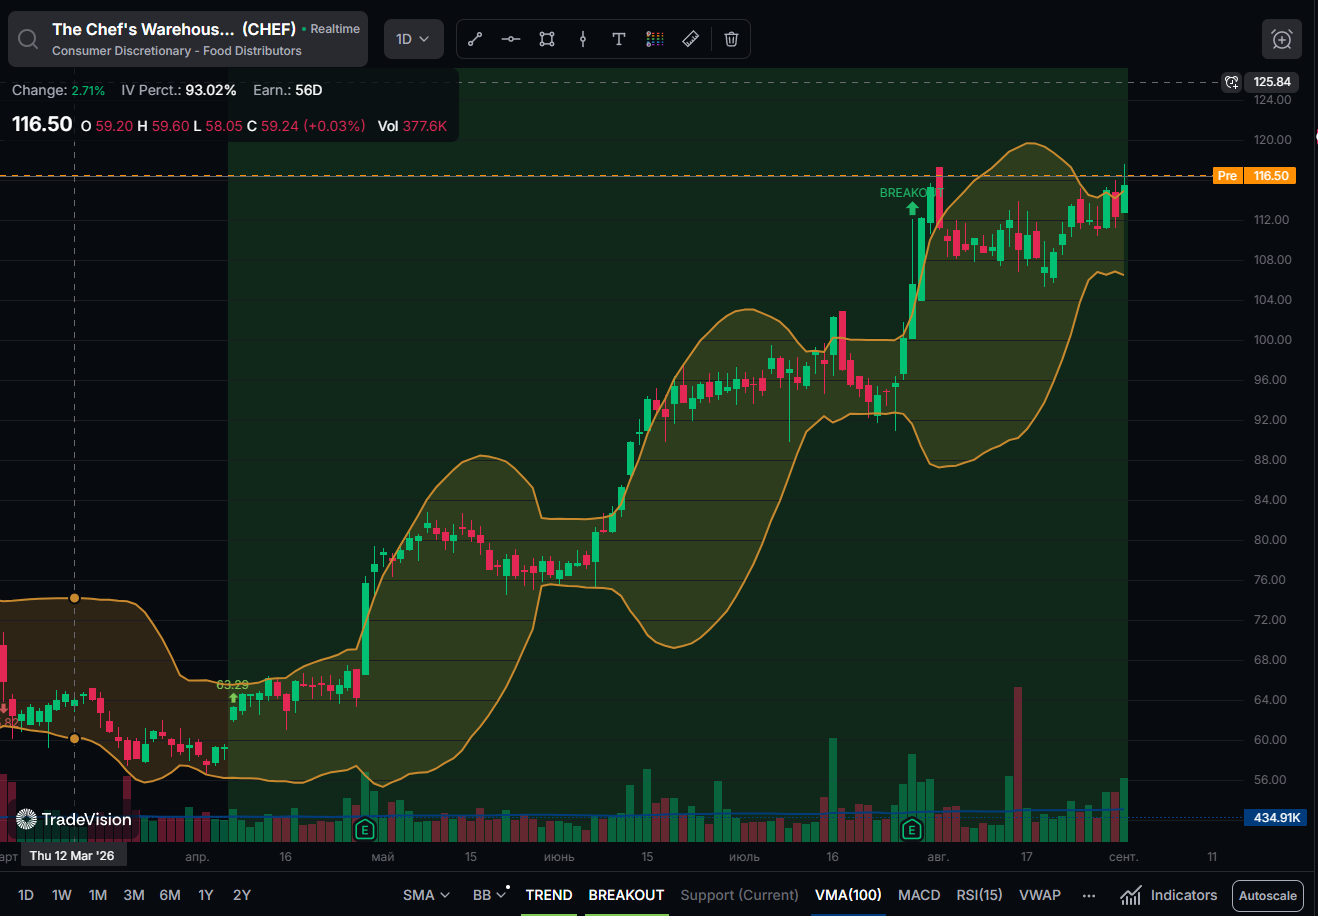
Two practical notes from the session with $CHEF in question:
- Round the level. If support sits around $103.40, calling it $103 is easier to work with and no less accurate for planning purposes
Write it on the chart. Use the text tool to label the level and the plan. You will come back to this chart in three weeks with no memory of what you were thinking

Step 2: Decide Entry, Stop and Risk Before You Commit
This is the part that makes the difference, and it takes about two minutes.
The following is a hypothetical worked example from the session, using Chef's Warehouse purely to illustrate the method. It is not a recommendation and not advice.
| Element | Level | Reasoning |
| Support | $103 | Former resistance, now the level buyers would be expected to defend |
| Intended entry | $106 | Close enough to support to be a reasonable entry, without insisting on a perfect fill |
| Stop loss | $94 | Placed below the 50 period moving average |
| Risk per share | $12 | Entry minus stop. This is the number that determines position size |
Illustrative only. Levels chosen to demonstrate the process.
Why the entry is above support, not at it
Insisting on $103 exactly means you may never get filled. Stocks rarely touch a level precisely and then turn. Allowing a window, in this case roughly 3% above support, gives you a realistic chance of entering while still buying near the level rather than chasing the high.
The alternative is worse. Buying the breakout at the top, around $117 in this example, would have put the position down roughly 7% within days. Not fatal, but an uncomfortable start that a little patience avoids.
Why risk per share is the number that matters
Entry minus stop gives you $12 per share at risk. That single figure tells you how large a position you can take.
If you are willing to risk 1% of a $10,000 account on a trade, that is $100. Divided by $12 per share, the position is 8 shares. On a $50,000 account risking 1%, it is 41 shares.
Without that number you are sizing positions by feel, which is how one bad trade does damage that ten good ones have to repair.
One honest observation on this example: a $12 stop on a $106 entry is a wide stop, around 11%. That is a deliberate trade off. A wider stop means a smaller position but more room for normal movement. A tighter stop allows a larger position but gets hit more often by noise. Neither is correct, but you should know which you are choosing.
Step 3: Set the Alert and Stop Watching
Nobody sits in front of a chart all day. Alerts are what make a plan work when you are not looking.
In the session the alert was set at $106.50, slightly above the intended entry of $106. That is deliberate. The alert is not the trigger to buy, it is the prompt to go and look. By the time you open the chart the stock is where you wanted it rather than already past.
Setting a price alert

- Click the alarm clock icon in the upper right of the chart
- Select Create New Alert
- Choose the condition: moves above, moves below, or crosses
- Enter your price
- Add a note, for example "approaching my entry", so the alert makes sense when it arrives days later
Save
Move your cursor over the chart and an alarm clock icon follows the price on the right hand side. Click it to set an alert at that level directly.
Moves above, moves below, or crosses
Crosses triggers in either direction. Moves above and moves below are directional. Use crosses when you care that a level was reached at all, and the directional options when only one direction is meaningful to your plan.
Make sure the alert can actually reach you
- Enable web notifications with the bell icon in the alert panel, and allow notifications in your browser when prompted.
- Install the mobile app (https://apps.apple.com/gb/app/tradevision/id6738501644
https://play.google.com/store/apps/details?id=com.tradevision.prod) and sign in with the same account, so alerts reach you away from your desk
An alert that fires into an empty browser tab is not much use.
Alerts Beyond Price
Under the Advanced tab, alerts can be based on more than price.
Volume alerts
Switch the criteria from price to volume, then set a threshold. Two approaches work well:
- An absolute figure, for example alert when volume moves above 2 million. Simple and predictable
- A percentage change, for example volume moving above by 100%, which flags a doubling against the normal level
Unusual volume is often the first sign that something has changed in a name you are watching.
Moving average crossover alerts
You can set an alert for when one moving average crosses another, most commonly the 50 period crossing the 200 period. Those crossovers are known as the golden cross when the shorter average crosses above, and the death cross when it crosses below. Only useful if crossovers are part of your strategy, but if they are, the alert removes the need to check.
Confirming a Level with Fibonacci
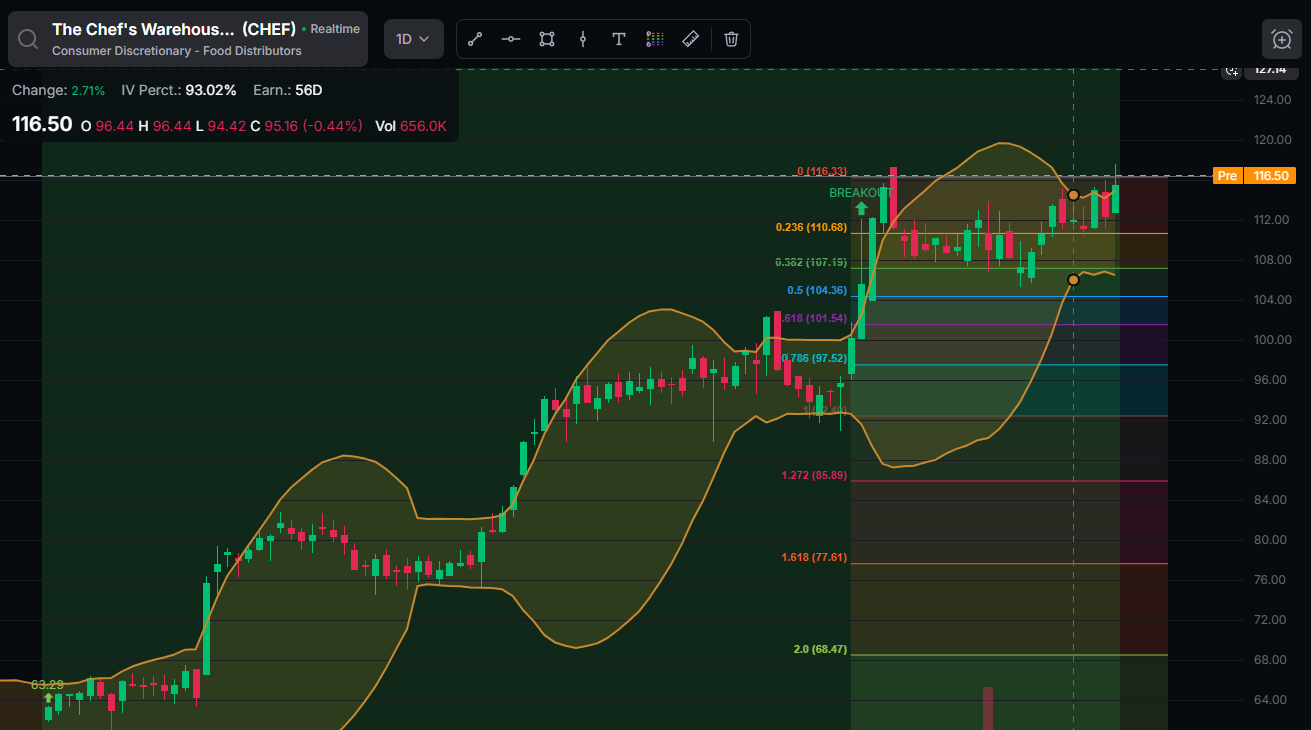
Once you have a support level, it is worth checking whether anything else agrees with it.
Fibonacci retracement measures how far a stock has pulled back within a trend. Draw it from the low of the move to the high, and it produces a set of levels where price often reacts.
In the session, drawing the retracement on the weekly chart put the 0.236 level almost exactly on the $103 support that had already been identified from price structure alone.
That is confluence. Two methods, arrived at separately, pointing at the same price. It does not guarantee anything, but a level that shows up twice deserves more weight than one that shows up once.
Worth knowing: the platform currently offers Fibonacci retracement but not extensions, so projecting upward targets has to be done another way, typically by treating a previous high as the next resistance.
The Point of All of This
Nothing above predicts anything. The level might fail, the alert might never fire, the stock might gap straight through the stop. All of that is normal.
What the process does is separate the thinking from the doing. You decide what a reasonable entry looks like, what you are willing to lose, and how much you can size, at a moment when there is no pressure and no position. Then the alert tells you when the moment has arrived, and all that remains is execution.
That is a very different experience from watching a stock run and deciding in real time whether to chase it.
TradeVision is a research and analysis platform, not a broker. Orders are placed through your own broker. Nothing here is financial advice, and all examples are hypothetical and for education only.


