
Quick Answer: Understanding Stock Data with TradeVision's AI Analysis
TradeVision's AI analysis (ANI) helps users interpret key stock data points like market cap, implied volatility, and options activity for companies such as Starbucks. By examining these metrics, users gain a comprehensive view of a stock's behavior, enabling more informed research and analysis within the TradeVision platform, which is a research tool and not a broker.
Key Stock Data Points Explained by TradeVision's AI Analysis
TradeVision's AI analysis (ANI) helps users understand various data points for a specific stock, using Starbucks as an example. Understanding these metrics provides valuable insights into a stock's performance and aids in research.
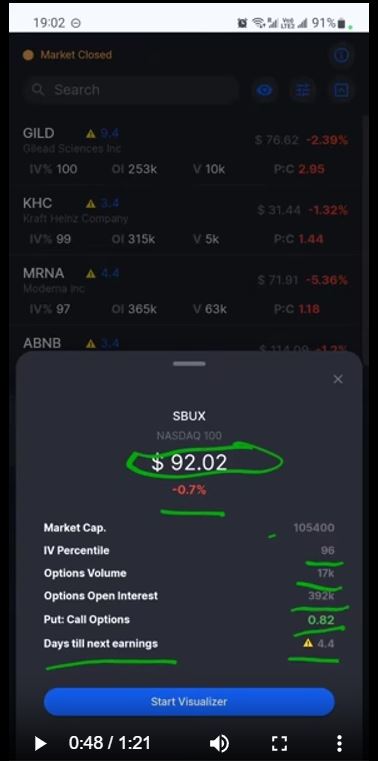
- Market Cap: This metric reflects the total market value of Starbucks’ outstanding shares. It helps gauge the company’s size and stability. TradeVision's platform allows users to view how Starbucks compares to other companies based on market capitalization.
- Implied Volatility (IV) Percentile: Implied volatility indicates the expected magnitude of a stock's price movement relative to its historical volatility. This percentile ranks Starbucks’ volatility against its past range. A high percentile suggests greater anticipated movement, which is relevant for options analysis.
- Options Volume: This figure represents the total number of options contracts traded for Starbucks over the last trading day. It provides an indication of options trading activity, which can suggest market sentiment and potential price movements.
- Open Interest: This measures the total number of outstanding options contracts for Starbucks across all expiration dates and strike prices. High open interest can signal significant investor interest and liquidity.
- Put/Call Ratio: This ratio compares the number of put options (contracts betting on a price decrease) to call options (contracts betting on a price increase). A higher ratio may suggest bearish sentiment, while a lower ratio can indicate bullish sentiment.
- Days Until Next Earnings: Knowing the days remaining until Starbucks’ next earnings report is crucial for anticipating potential price movements and volatility. Earnings reports can significantly impact stock prices, so this data point helps users plan their research.
Navigating the Stock Screener with TradeVision
TradeVision's stock screener presents these data points in a user-friendly format for efficient analysis. For example, when examining Qualcomm in the screener, users can quickly see:
- Days Until Earnings: Qualcomm’s earnings report is in 3.4 days.
- Stock Movement: The stock has moved by 5% recently.
- Options Volume and Open Interest: These metrics provide insights into recent trading activity.
- Put/Call Ratio: Gives users a sense of market sentiment.
- Share Price Movement: Indicates how the stock price has changed today or in the most recent trading session.
By interacting with each data point within TradeVision, users can access more detailed explanations and better understand how each metric affects a stock’s performance.
Conclusion: Leveraging TradeVision for Stock Data Analysis
With TradeVision's AI analysis (ANI), exploring stock data is straightforward and informative. By examining metrics like market cap, implied volatility, options volume, open interest, the put/call ratio, and days until earnings, users gain a comprehensive view of a stock’s behavior. This detailed understanding helps users make more informed investment decisions, recognizing that TradeVision (tradevision.io) is a research platform and not a broker, requiring users to trade through their own brokerage account.


