
In TradeVision we use a variety of specialized terms in our interface, which can sometimes be confusing for new users. To help you navigate and understand these concepts more easily, we’ve put together this brief glossary. Do not hesitate to reach to this article whenever you feel overwhelmed by the design.
Common terms
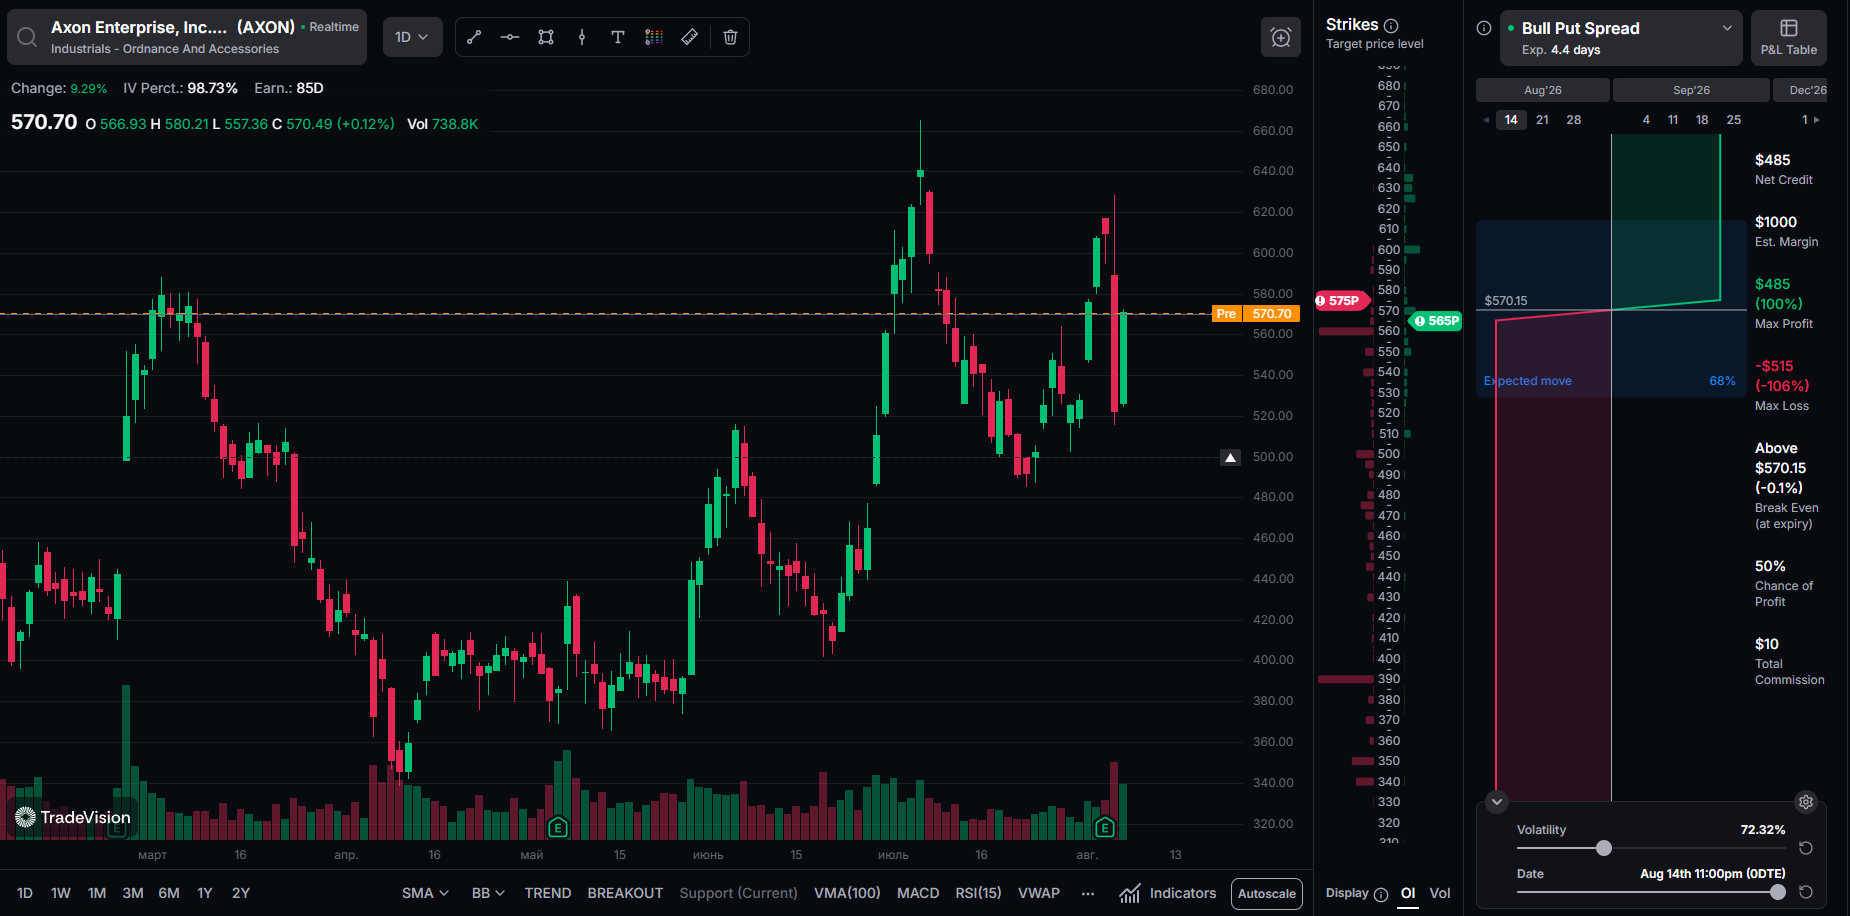
Charts (Advanced Charts, Visualizer) — An advanced chart is a detailed graphical representation of a stock's price movement over time. It includes various technical analysis tools, such as trendsAI Indicator, moving averages, volume indicator, and breakout indicator.
Bullish — Positive outlook on a stock, market, or asset. The signals with marks Bullish and HOLD are stored here.
Bearish — The opposite of bullish. It refers to a negative outlook on a stock, market, or asset. The signals with marks Bearish, HOLD, and neutral appear here.
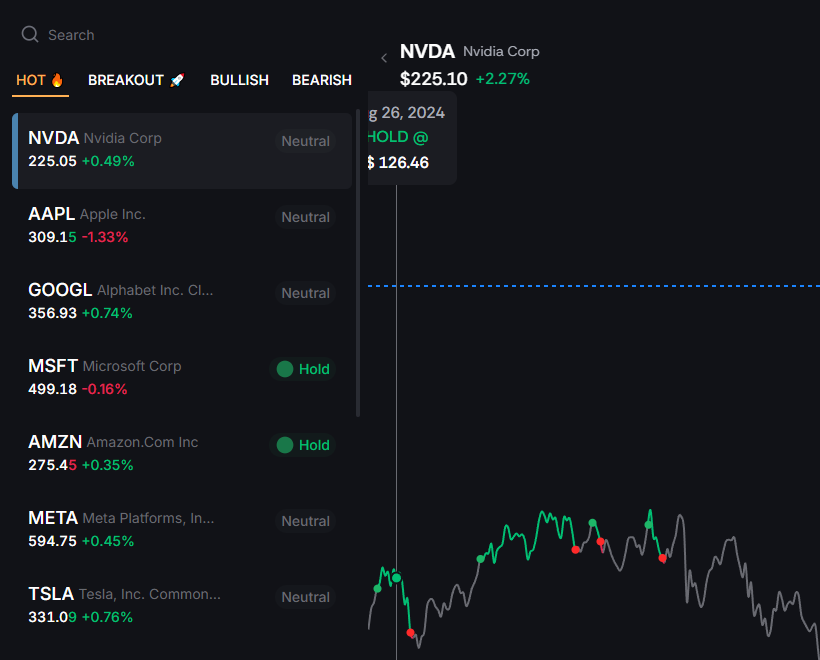
Neutral — Market outlook where an investor or analyst expects prices to remain stable or move sideways, with no significant upward or downward trend.
Hold — Recommendation or strategy where an investor retains their current position in a stock without buying more or selling. If you already bought it, it suggests keeping it, but not BUYing more.
Buy and Hold — Long-term investment strategy in which an investor buys stocks and holds them for an extended period. We compare the trendsAI performance to this strategy's returns to showcase our advantage over the overall market.
Screener — Tool used to filter and identify stocks based on specific criteria, such as market cap, options IV%, put/call ratio, etc.
Indicator — An indicator is a statistical tool used in technical analysis to predict future price movements.
Watchlist — A watchlist is a curated list of stocks or assets that an investor monitors for potential buying or selling opportunities. You can have up to 10 watchlists with an unlimited number of stocks in any of them.
Ticker — A ticker is a unique symbol assigned to a publicly traded company's stock. It is used to identify the stock on exchanges and financial platforms. For example, Apple's ticker is AAPL, and Tesla's ticker is TSLA.
Candle (candlestick) — Type of chart used in technical analysis to represent the price movement of a stock over a specific time period (e.g., 1 minute, 1 hour, 1 day).
Smart Money (Dark Pool) — Smart money refers to the investments made by experienced, well-informed investors or institutions (e.g., hedge funds, mutual funds). You can use the SMART tab to check their moves.
P&L (Profit and Loss) — Financial statement, that summarizes the outcomes of trades in a simple resulting value.
Unrealized P&L — Unrealized P&L refers to the profit or loss on an investment that has not yet been sold. It represents the current value of the investment compared to its purchase price.
TradeVision Indicators
TrendsAI v0 — unique long-only AI-trained indicator, that provides regular entry and exit signals, based on the EMA and ATR strategies. Has the best cooperation with MA lines. Only available on 1 day timeframe.
TrendsAI v3 — another version of trendsAI, that has both long and short signals available. Less coverage.
Breakout Indicator — momentum indicator, that highlights stocks, that recently broke from their respective trading stages and now have higher probability for prolonged upward movement.
Charting
Volume — Volume refers to the total number of shares traded in a particular stock or the entire market during a given period.
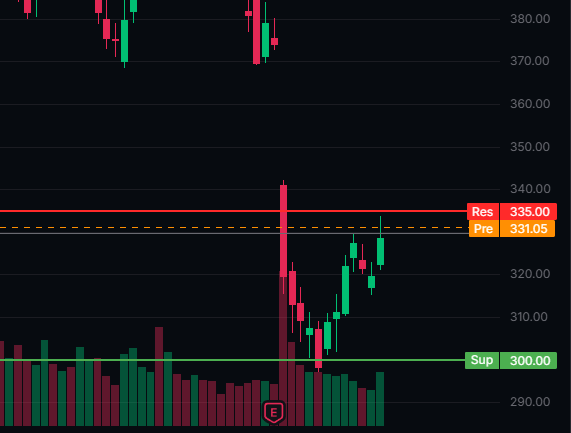
Support — Support is a price level at which a stock tends to stop falling and may even bounce back up.
Resistance — Resistance is the opposite of support; it is a price level at which selling interest is strong enough to prevent the stock from rising further.
Moving Average — A moving average is a technical indicator that smooths out price data over a specific period (e.g., 50-day or 200-day moving average) to identify trends.
Screener
Earnings — Company's profit during a specific period, usually reported quarterly or annually.
Dividends — A portion of a company’s earnings paid out to shareholders, typically on a quarterly basis.
Marketcap — Market cap is the total value of a company's outstanding shares. It is calculated by multiplying the current stock price by the total number of shares.

