Quick Answer: How Technical Analysis Boosts Options Trading Strategy
Technical analysis enhances options trading strategies by providing a framework to predict future price movements based on historical data. It helps traders identify optimal entry and exit points, understand market momentum, and manage risk more effectively. For options, where timing is critical due to expiration dates, technical analysis offers valuable insights into when and how much a stock might move, improving decision-making for contract selection and trade management.
Why Technical Analysis Matters in Your Options Trading Strategy
Technical analysis is the study of price and volume data to predict future movements in the market. For options traders, timing is everything. Unlike buying stocks and holding for the long term, options contracts come with expiration dates. This means you need to be more precise about when a stock might move and by how much.
Technical analysis helps by analyzing historical price movements, chart patterns, and technical indicators to make more informed decisions about entry and exit points. It can:
- Help you time your trades better
- Identify momentum shifts
- Spot breakout and breakdown opportunities
- Reduce unnecessary risks
For example, planning a call option on a stock forming an ascending triangle, a bullish pattern suggesting an upcoming breakout, can be informed by technical analysis. Entering the trade before the breakout with the right strike price and expiration date can be crucial. TradeVision's charting tools and pattern recognition features can assist in identifying potential setups, but successful interpretation still requires user understanding. TradeVision is a research platform and does not execute trades; users must place trades through their own broker.
Core Technical Tools to Enhance Your Options Trading Strategy
There are many indicators and charting tools available, but focusing on a few essential methods can be more effective for building or improving your options trading strategy. Here are key technical tools and their applications:
1. Moving Averages
Moving averages smooth out price data to help identify trends. A simple moving average (SMA) shows the average closing price over a period, while an exponential moving average (EMA) gives more weight to recent prices.
Use them to:
- Confirm trends (bullish or bearish)
- Spot crossovers (e.g., 50-day crosses above 200-day = bullish indicator)
- Set dynamic support/resistance levels
2. Relative Strength Index (RSI)
RSI is a momentum indicator that suggests whether a stock is overbought or oversold.
- RSI > 70: Overbought (potential reversal down)
- RSI < 30: Oversold (potential reversal up)
This is particularly useful when selecting entry points for short-term options.
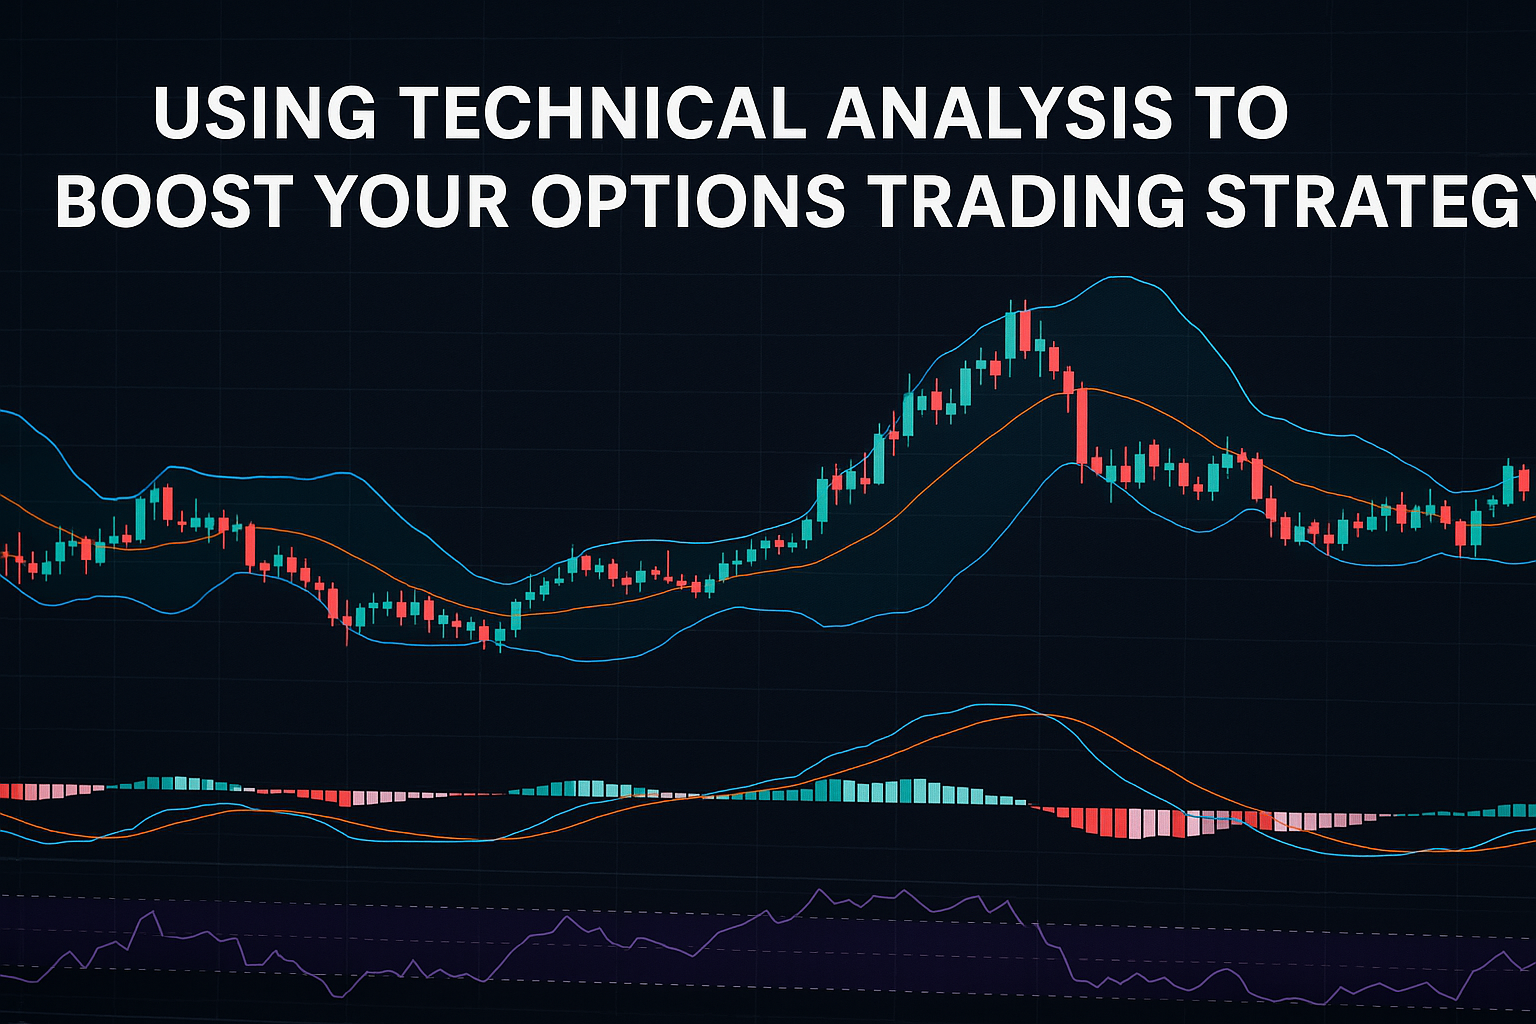
3. Bollinger Bands
These bands measure volatility and can help detect price breakouts or breakdowns.
- When the price touches the upper band, it might be overbought.
- When it touches the lower band, it might be oversold.
Combined with volume analysis, this can be a valuable tool for timing trades.
4. MACD (Moving Average Convergence Divergence)
MACD tracks the relationship between two EMAs (typically the 12-day and 26-day). It is useful for spotting trend reversals and momentum shifts.
TradeVision offers these indicators in an easy-to-use format, allowing users to layer them and set custom alerts. The platform does not offer backtesting.
How to Build a Technical-Based Options Trading Strategy
To effectively integrate technical analysis, the goal is to create an options trading strategy that is structured, consistent, and repeatable. Here is a sample blueprint that can be adapted to your individual style:
Step 1: Screen for Candidates
Use stock screeners, such as TradeVision's built-in stock screener, to find stocks that are forming strong technical setups. Focus on high-volume names to ensure sufficient liquidity in the options market.
Step 2: Analyze the Chart
Pull up a daily or hourly chart and apply the indicators discussed. Look for:
- Strong trend patterns (uptrend/downtrend)
- Momentum indicators (RSI, MACD)
- Support/resistance zones
- Breakout or breakdown setups
Step 3: Choose the Right Options Contract
Based on your technical analysis:
- If a breakout appears imminent, you might consider a call option.
- If you identify a top forming, consider a put option.
- Adjust your strike price and expiration based on expected movement and timeframe.
Step 4: Set Entry and Exit Points
Plan your trade before entering. Use stop losses and profit targets based on chart levels. Technical analysis helps set these boundaries with more accuracy.
Step 5: Monitor & Adjust
Once the trade is active, continuously monitor the chart. Price might react to support/resistance, or RSI might indicate a shift. Be prepared to take profits or cut losses if the setup changes.
Bonus: Common Patterns Worth Knowing
These classic patterns often precede significant moves:
- Cup and Handle – Bullish continuation
- Double Top/Bottom – Reversal indicator
- Head and Shoulders – Bearish reversal
- Flags and Pennants – Continuation patterns
TradeVision's charting tools include pattern recognition features that can help identify these classic patterns, assisting users in their analysis.
Final Thoughts
Technical analysis is not a guaranteed predictor, but when combined with sound risk management, it can transform your options trading strategy into a more consistent and informed approach. Start with basic principles, maintain discipline, and utilize research tools like TradeVision (tradevision.io) to guide your decision-making. TradeVision is a research platform and does not execute trades; users must place trades through their own broker.
Whether you are a beginner learning to interpret charts or an experienced trader refining your edge, technical analysis is a valuable skill in options trading. Happy trading!